Debut of the 5-Day Graphical Tropical Weather Outlook
For many years NHC’s forecasts of tropical cyclone formation extended only 36-48 hours into the future. Recent advances in numerical modeling, however, as well as improved understanding of some of the physical triggers for genesis, prompted NHC to begin an in-house experiment to see whether its genesis forecasts could be extended. The four-year experiment showed, somewhat surprisingly, that a five-day tropical cyclone forecast could be made with nearly the reliability of the existing 48-hour forecasts, and NHC publicly extended the range of its Tropical Weather Outlook (TWO) text product to five days on August 1st of 2013.
In its present form, the text TWO describes areas of disturbed weather and their potential for development into a tropical or subtropical cyclone. This description normally includes discussion of the large-scale factors that could influence development, the general motion of the disturbance and any hazards that might affect land areas, and concludes with a quantitative forecast of formation likelihood for both the next 48 hours and the next five days.
The New 5-Day Graphic Explained
Beginning today, July 1, 2014, at 2 PM EDT (11 AM PDT), the text TWO will be accompanied by an experimental graphical depiction of the five-day potential cyclone genesis areas. These areas will appear as color-coded hatched areas (yellow, orange and red representing low, medium, and high risks of tropical cyclone formation, respectively). Although the areas or swaths don’t explicitly represent a track forecast, they do provide a general indication of where these systems are headed whenever the formation potential extends over several days.
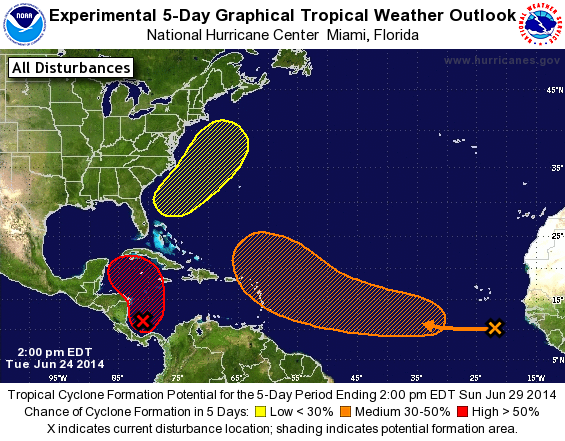
If a hatched formation area is associated with a currently existing disturbance, the location of the disturbance is marked with an ‘X’ on the graphic. Arrows are used to link the location of a disturbance with its potential genesis area if the formation area is displaced from the current location of the disturbance. The overview graphic (above) can occasionally become crowded with disturbances, especially during the peak of the hurricane season, so separate graphics for each disturbance are created to ensure legibility.
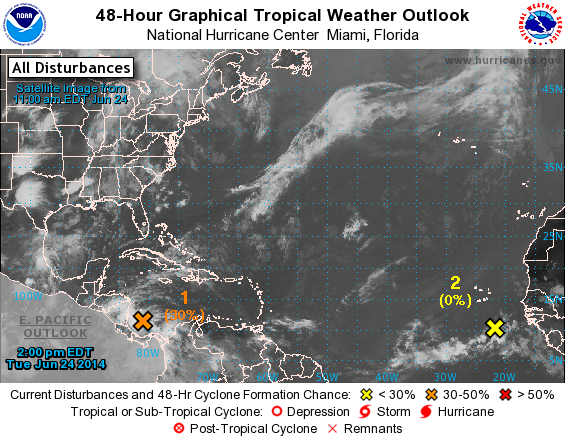
The introduction of the five-day graphic on July 1st will be accompanied by an important change to the existing 48-hour graphic. Disturbances on this graphic will no longer be identified with circles or ovals; instead the location of current disturbances will be marked with an “X” for consistency with the five-day graphic.
In a future blog post we’ll be talking about how NHC’s Hurricane Specialists arrive at the formation probabilities appearing in the TWO, as well as some experimental guidance and ongoing research projects that might allow us to extend these genesis forecasts even further in time. In the meantime, we welcome user feedback on the new graphic, which can be provided at http://www.nws.noaa.gov/survey/nws-survey.php?code=FDGTWO
The following video also provides a description of the new 5-Day Graphical Tropical Weather Outlook:

